Why Is There No 100% Winning Technical Indicator?
Which Is The Best Technical Indicator In The World?
This is perhaps the very first question most beginners to technical analysis ask when they begin their journey in technical analysis. What is that singular piece of graphical line you can
overlay onto your stock chart such that you will always be able to predict the stock price perfectly in order to get in on the bottoms and out on the peaks? However, to the dismay of
all such seekers, there exist no such technical indicator, as such, there is no such thing as the best technical indicator in the world. Why is that so? There are MANY reasons why this is
so and one such reason is that technical indicators DO NOT work singularly.
No Technical Indicators Work Singularly
If you have peeked at the stock chart of a professional options trader or a professional technical analyst, you might have noticed that the screen is usually cluttered with numerous
different indicators. Even if it doesn't look cluttered, there is definitely more than just a couple of indicators on the screen. This should immediately tell you that technical indicators
do not work well on their own singularly. In fact, in my personal experience and tests, I find that there is only about a 50/50 chance that any single technical indicator correctly
predicts future stock price with very statistically insignificant inclination towards 60% in some cases (even that is only under very specific market conditions and price behaviors).
What does 50/50 mean? Well, 50/50 means that the results are RANDOM! That there
is an equal chance of it being correct or wrong! If a technical indicator is capable of even producing a statistically consistent wrong result like 75% of the time, you've got yourself
a WINNER! You simply have to take it as a contra-indicator and trade opposite to its results consistently in order to win! How then can technical analysis be employed in order to produce
a highly reliable executable conclusion? By COMBINING technical indicators that work well with each other!
BUT I Have Seen A Single Best Technical Indicator!
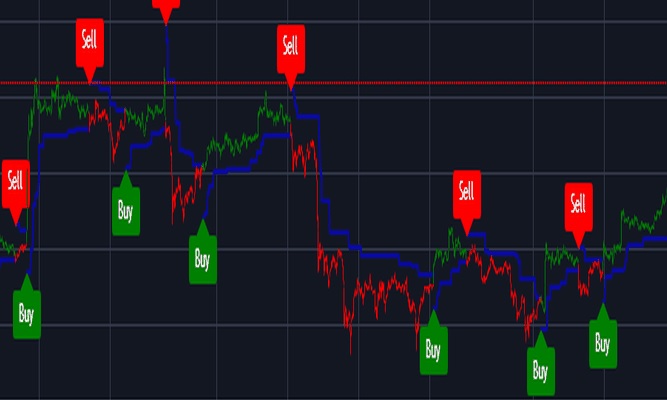
Just like you have to combine different ingredients in order to make a dish or a drink, technical indicators used singularly are merely plain water. However, you might have seen some technical analysis "education" graphics showing how a stock price obediently does EVERYTHING EXACTLY how a single technical indicator indicates; buy here, sell there, buy here, sell there, exactly right on the peaks and the bottoms, more obedient than the dog you've fed for more than 10 years. Why is that so and how does it happen?
It happened because there is no such thing as an objective back test result when it comes to applying technical indicators to a historical price chart. Even if you run a black and white formula through a simulation like monte carlo, you then get the other problem which is the lack of "Significance" in the results. The problem with applying a technical indicator to a historical price chart is that you can always find a specific stock with a specific price behavior over a specific timeframe in order to produce a miraculous result with that single indicator. This is usually done by people selling some kind of trading software. However, when you apply that indicator to a wide range of price behaviors and market conditions, it starts to fall apart. Such "data mining" approach is widely misused in the industry in order to peddle false beliefs in a new "magic indicator".
If there is no such thing as a single best indicator, does that mean technical indicators are worthless? Far from it! The key is to know how to use technical indicators in COMBINATION for technical analysis.
Using Technical Indicators in Combination
When you combine technical indicators that WORK WELL with each other, you begin to be able to overlap the 50% accuracy of one indicator with the 50% accuracy of another indicator to produce a statistically higher accuracy. However, the key phrase here is "WORK WELL with each other". Not all technical indicators work well with each other and to know which technical indicator work well with another, you need to understand the type or category of the technical indicators you are looking at. Technical indicators are largely categorized as "Leading Indicator", "Lagging Indicator", "Confirming Indicator" and "Contra Indicator" and presented graphically as indicators or oscillators.
Even without any further explanations, you should start to see the point now. Combining technical indicators of DIFFERENT categories is the key here so that the convergence of their results triangulates in a more meaningful way, like taking a GPS fix of a position using 2 or more GPS satelites. However, the problem most beginner or even veteran options traders face is that they don't even understand which category the technical indicator they are using belongs to! It is not the purpose of this article to go deeply into the different indicators and their categories and what goes with what but to shed light on this issue so that you can begin to research and learn deeply into the technical indicators you are using.
So, does it mean that the more technical indicators that you overlay onto your chart, the more accurate it becomes?
Ironically, it doesn't work that way either. In the world of investment analysis and technical analysis, a phenomena called "over optimization" exists. The more you try to optimize your results by combining more and more indicators, the worse the results tend to become over a certain point. In my experience, I would say the optimum number of technical indicators in one chart setup is 2 to 3. Anything more tends to spoil the broth.
Another thing to take note of is that not all technical indicators of different categoies work well with each other either! There are technical indicators that work very well with each other and some that do not. So you want to make sure the indicators you are trying to combine makes sense on the level of their formula logic and the overall picture presented by the combination of their mathematical logic.
Finally, you want to make sure you use an appropriate set of technical indicator combination to the type of stock or price chart you are performing technical analysis based on. Some set of indicators work well on more volatile stocks, some work better on more stable stocks, some work better on the daily time frame, some work better on the weekly timeframe etc. You need to understand the tools you are using enough to know if it applies to the stock or market you are looking at.
No Technical Indicators Are Singularly Effective
As you can see, issues like this and MORE makes technical analysis a truly challenging endeavor. You need a truly deep level of understanding of the mathematics and logic of each technical indicator in order to
be able to put them together meaningfully. After you do, you still need to be able to overcome the various psychological and perceptive hurdles in order to correctly interpret the results. Visit and bookmark
Options Trading Insights for Veteran Options Traders to read about and understand the various challenges
that needs to be overcomed in order to achieve consistent profitability in options trading and technical analysis.
|
|
Explore another very common psychological reason which makes technical analysis so difficult: Hope vs Reality. |
| Javascript Tree Menu |
Important Disclaimer : Options involve risk and are not suitable for all investors. Data and information is provided for informational purposes only, and is not intended for trading purposes. Neither www.optiontradingpedia.com, mastersoequity.com nor any of its data or content providers shall be liable for any errors, omissions, or delays in the content, or for any actions taken in reliance thereon. Data is deemed accurate but is not warranted or guaranteed. optiontradinpedia.com and mastersoequity.com are not a registered broker-dealer and does not endorse or recommend the services of any brokerage company. The brokerage company you select is solely responsible for its services to you. By accessing, viewing, or using this site in any way, you agree to be bound by the above conditions and disclaimers found on this site.
Copyright Warning : All contents and information presented here in www.optiontradingpedia.com are property of www.Optiontradingpedia.com and are not to be copied, redistributed or downloaded in any ways unless in accordance with our quoting policy. We have a comprehensive system to detect plagiarism and will take legal action against any individuals, websites or companies involved. We Take Our Copyright VERY Seriously!
Site Authored by